by Miriam Friesen
Is anyone else as curious as I am about what kind of impact those solar panels on the roof are having, how Hamline Church’s energy use has changed over time, and what our “new normal” is for how much of Hamline Church’s electricity comes from the sun vs. the grid? Or is it just me and my nerdy fascination with charts? Well, even if you’re not as into charts as I am, I hope you’ll accompany me on this glimpse into electricity and energy use at Hamline Church.
First, thanks are due to Diane Krueger who has faithfully entered Xcel energy bills in an online system over the past four years. The data below are from both the online energy tracking system and the solar dashboard that we have access to through our solar installer. We keep the Xcel data as part of our commitment to St. Paul’s “Race to Reduce” program and as a Climate Justice Congregation through MNIPL. Our Climate Justice Congregation action plan for this year includes carrying out an updated energy audit for the church and this historical data will help us better understand our energy use in the time since our previous energy audit.
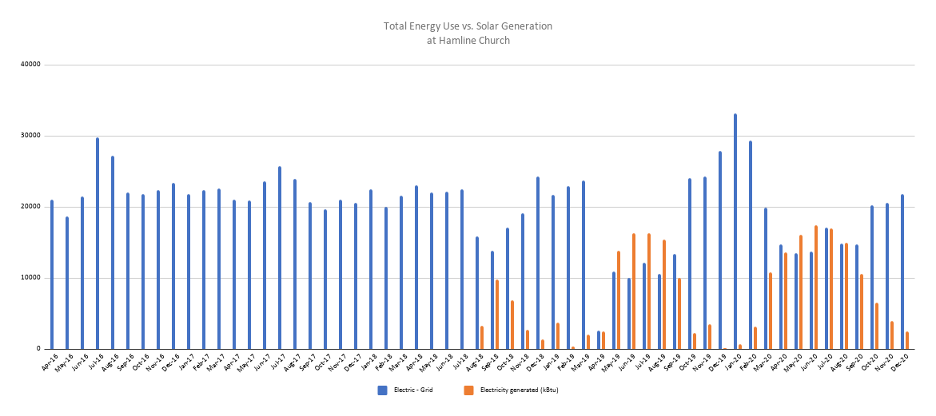
Here it is folks: electricity at Hamline Church, 2016-2020. In the blue, we have the amount of electricity that we use. In the orange, starting in August 2018, we have electricity that the church’s panels generate from the sun.
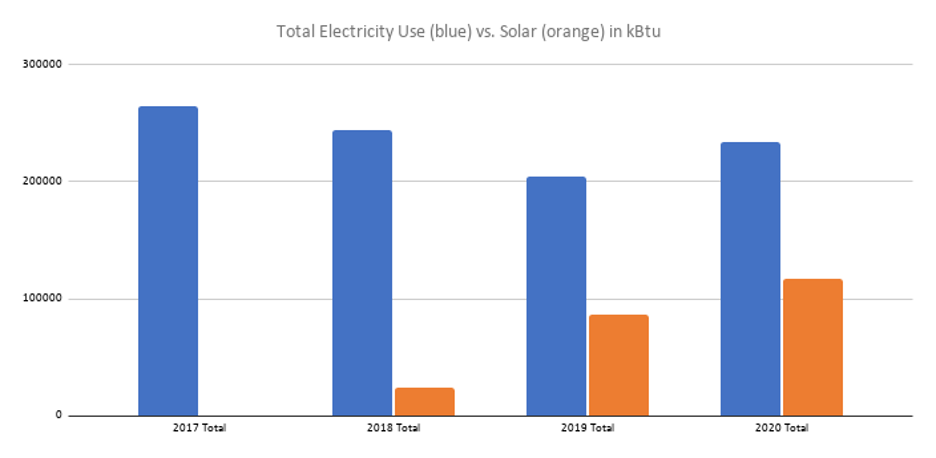
Here’s a summary of that same data, year by year in 2017-2020:
After you’ve had a moment to peruse the charts, here are a few of my own (very amateur) observations about the data:
Solar Generation Offset about 1/3 to 1/2 of Electricity Use 2019-2020
The second chart makes it really clear that solar generation offset a very significant portion of our church’s electricity use in 2019 and 2020, the first two full years we had solar, which is exciting news. If you look closely at the first chart, in some summer months the church’s solar actually generated more electricity than we used. That means that almost all of our AC use in 2019-2020 was offset by solar! While we don’t get “paid back” by Xcel when the church’s solar panels generate more electricity than we use in a month, the church is enrolled in a program to receive incentive payments for solar generation — a future blog post will describe that program and the benefits the church has received under it so far.
Why Does Solar Generation Vary So Much?
Year to year, solar generation varies based on weather trends. Based on solar data from around the Twin Cities, 2020 was a better than average year for generating solar power.
Definitely our best months are the summer months, and it’s easy to understand why: Winter months can be hard for solar when there’s snow cover on the panels for days or weeks at a time. The sun can melt snow off of panels fairly quickly, but if we have a stretch of cloudy days along with snow cover, the panels just can’t generate much during that time.
We also had an issue a couple of times in the past year where the solar panel system actually was turned off unexpectedly! And it was unfortunately a while before someone realized it needed to be turned back on. One of those times was October 12 – November 4, 2019, and another shorter period occurred in late 2020. Hard to get use out of our solar panels when they’re not even on! How could this happen? Well, the on-off switch to the solar system is a temptingly big and red handle in the alley on the south side of the church. Anyone could have turned it to the off position when wandering through the alleyway. The church office has now placed a padlock on that handle, which we believe will prevent it from going into the Down/Off position, and Earthkeepers are checking periodically to verify that it’s in the Up/On position. If you see it in the Down/Off position – please report to the church office ASAP!
Significant Decrease of Electricity Use in 2019-20 vs. 2016-18
This chart shows a pretty decent drop-off of overall electricity use in the last two years compared to the previous two years. Hooray!! In the time covered by this chart, the church has carried out a number of building improvements that should have impacted energy use, both during and before the Capital Campaign. We hope that our energy audit later this year may give us more info about how building improvements may have impacted electricity use, and what additional improvements we can make to help reduce energy use overall.
At any rate, its great news that not only did the church begin offsetting a significant portion of its electricity use in late 2018, the church also has significantly reduced its overall electricity usage!
What happened in April 2019?
Who knows, perfectly mild weather, but no sunshine? Just kidding, we think we might have a typo in the data entry for electricity use in April 2019. The bill for that month is temporarily unavailable so we unfortunately haven’t been able to doublecheck that number.
Spike of Electricity Use in Late 2019
Despite an overall decrease in electricity use in 2019, we do see those numbers go back up on the October – December bills, which corresponds to the big push for construction wrap-up in September – November of that year. Those capital campaign construction projects involved a lot of electricity-drawing equipment.
2020 Electricity Use Still High
…But – you may also be wondering why the electricity use remained just as high (actually, even a little higher) in 2020; after all, the construction wrapped up at the end of 2019 and the church was not really using the building after March 2020, right?
One reason for steady electricity use through 2020 is that the Learning Garden preschool in the basement continues to operate daily on weekdays throughout the year, and did continue to operate throughout 2020 despite the pandemic (much to the delight of our family – my son attends there daily!). That consistent week-long electricity use eclipses any savings we would have had from not using the sanctuary on Sundays.
Another activity that impacted electricity use was the window replacement project in the education wing. This involved a month and a half in fall 2020 when, at any given time, one classroom’s windows were entirely removed. Not only did this involve construction equipment with high electricity draw, but it also would have meant that the building wasn’t retaining temperature as it normally would. You can see a corresponding electricity spike in late 2020.
Finally, we all know that COVID-19 wreaked havoc on normal habits and priorities, which was also true for the church building use. I’ll protect my source here, but I heard it’s possible that the church office AC ran more in 2020 than usual, as office staff came and went at different hours than normal and maybe had more urgent things on their mind than non-pandemic routines like shutting off the AC at the end of the day. As much as I had hoped to see reduced electricity use when the church was using the building less during COVID-19, it makes sense in retrospect that it was not an ideal year for saving electricity.
My takeaway from this is that the way to get efficiency out of our building’s typical level of electricity use is to get as much actual use out of the building as possible. Another reason to look forward to the end of the pandemic and the return to in-person church activities!